- Pay Bill Billing
- Alerts & Outages Alerts
- Start/Stop Service Service
- Contact Contact
-
Log In to
My Account Log In
When autocomplete results are available use up and down arrows to review and enter to select.
CT Water Supply Updates
To view your water supply update, simply choose a report below.
Water Supply Update 01-16-20
Jan 16, 2020
Connecticut
Weekly Water Supply Update for our Darien, Greenwich, New Canaan, Newtown, Stamford and Westport Water Systems
A. System Status
Figure 1. Daily Water Demands | Download Chart PDF
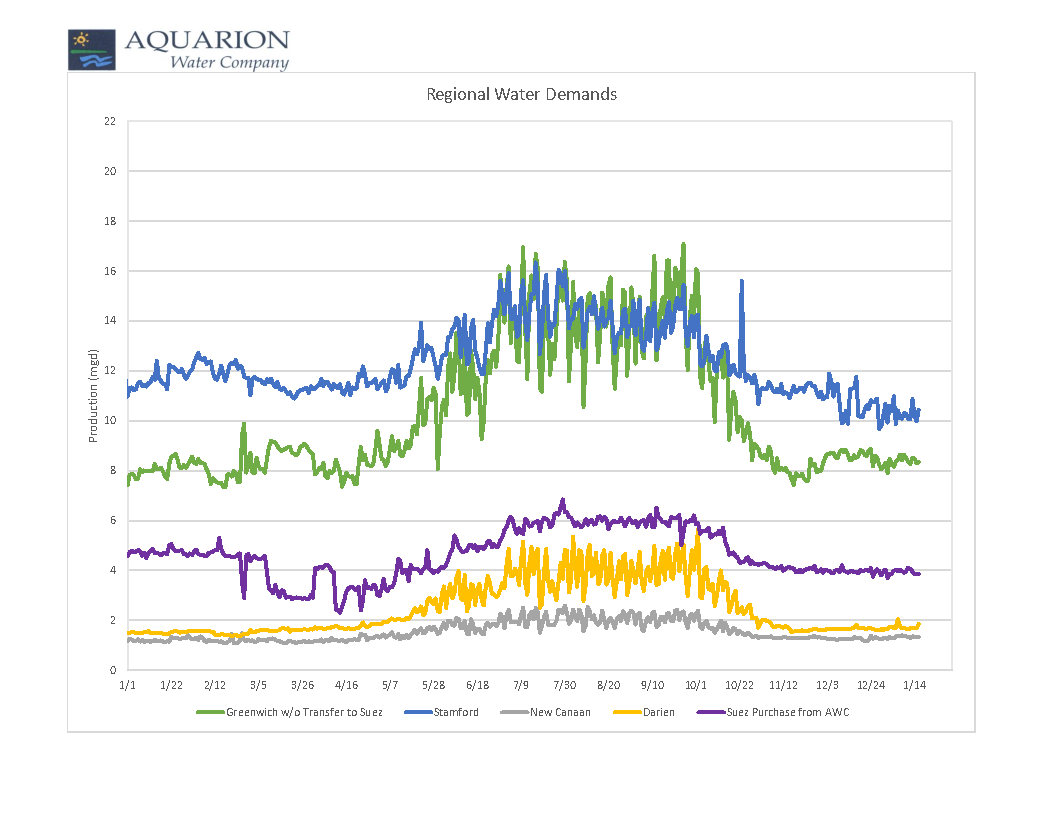
Figure 2. Daily Water Transfers | Download Chart PDF
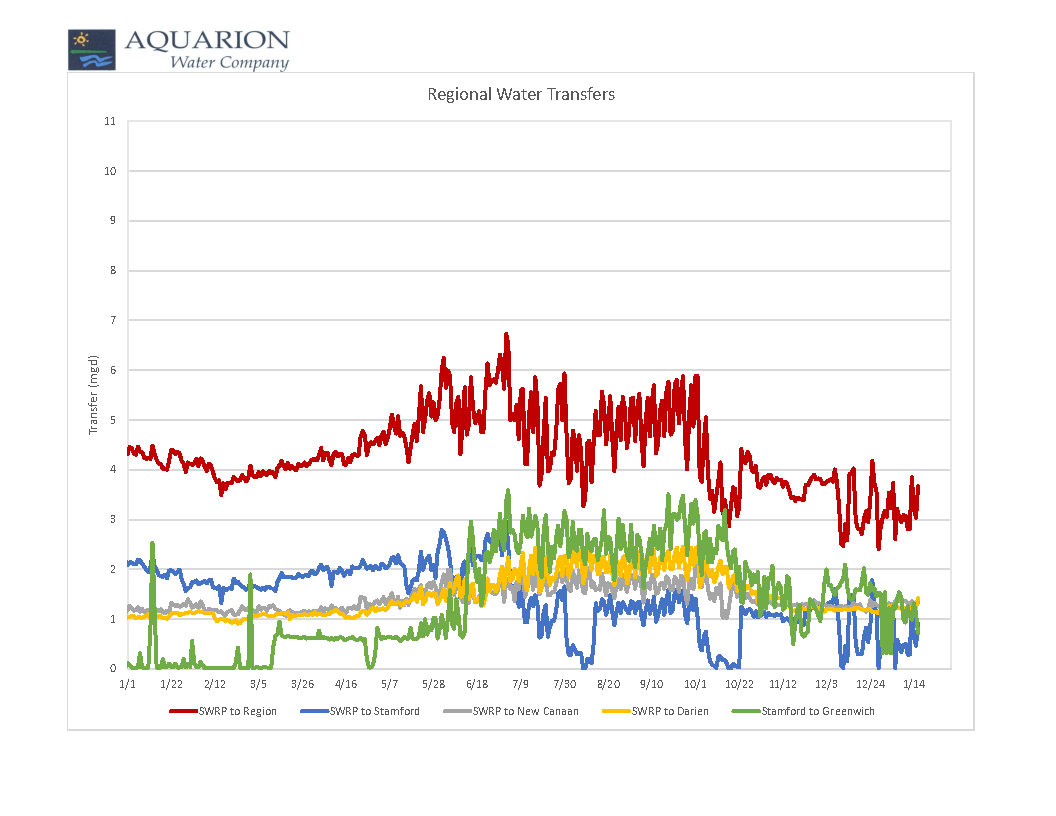
Figure 3. Greenwich Reservoir Status | Download Chart PDF
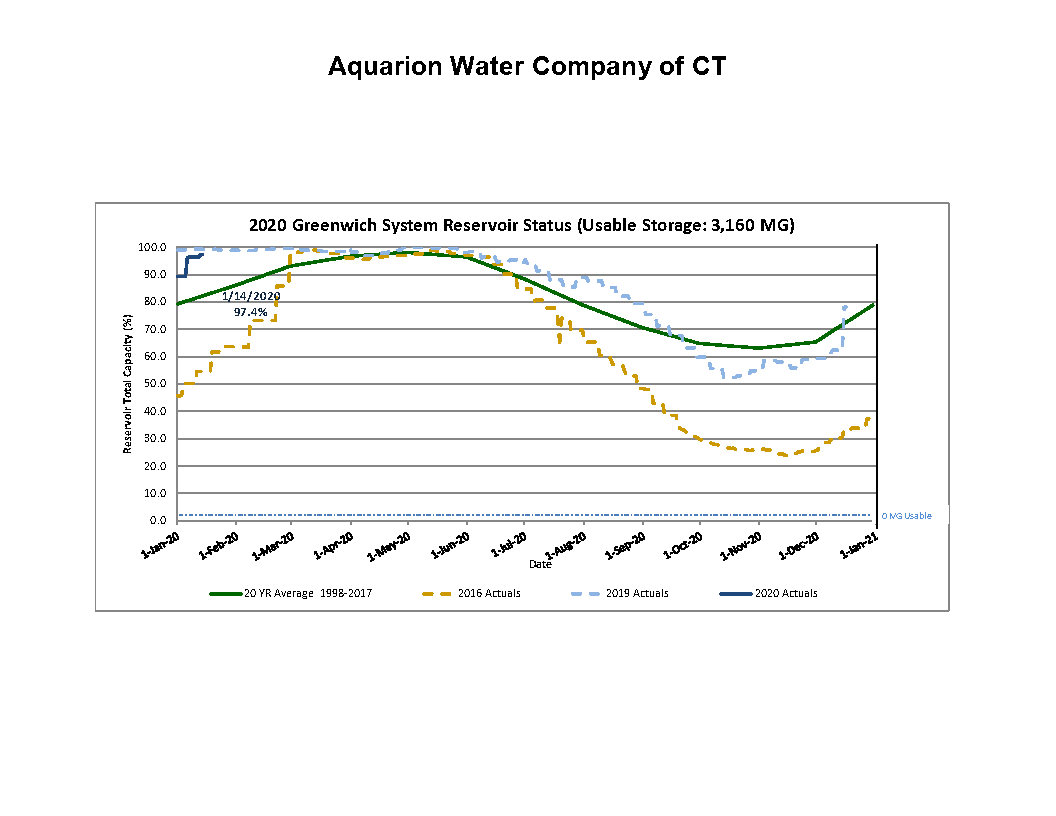
Figure 4. Stamford Reservoir Status | Download Chart PDF
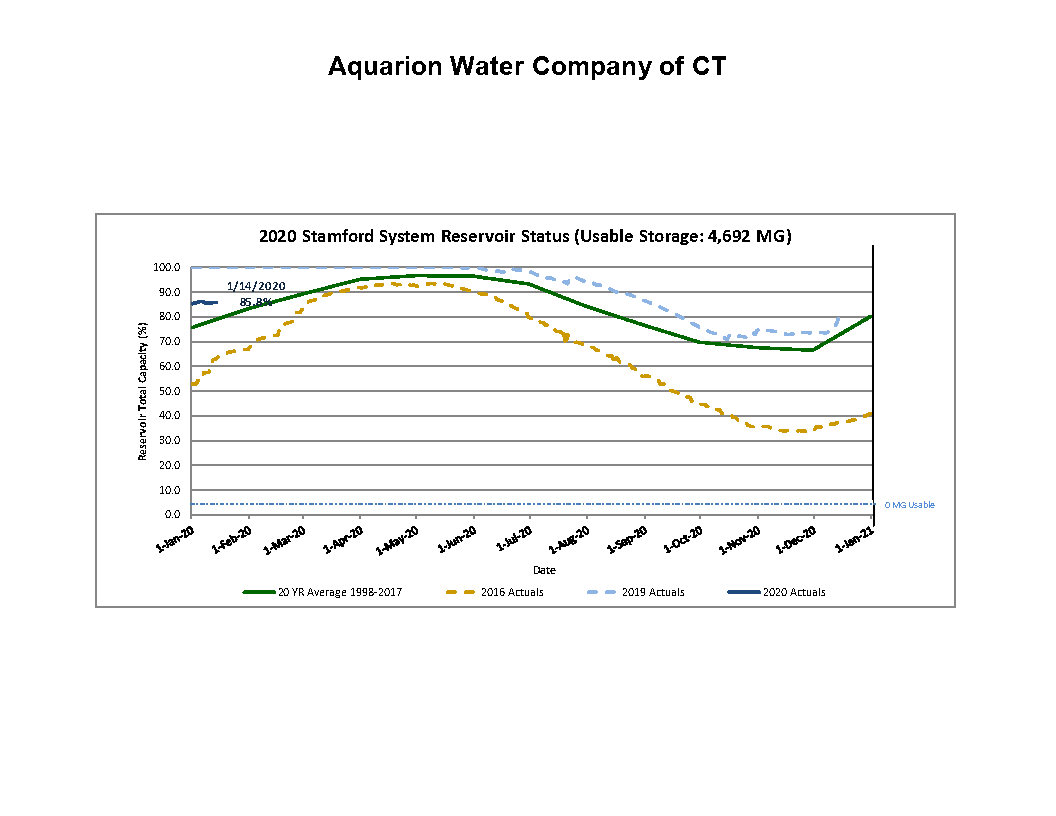
Figure 5. Greater Bridgeport Reservoir Status | Download Chart PDF
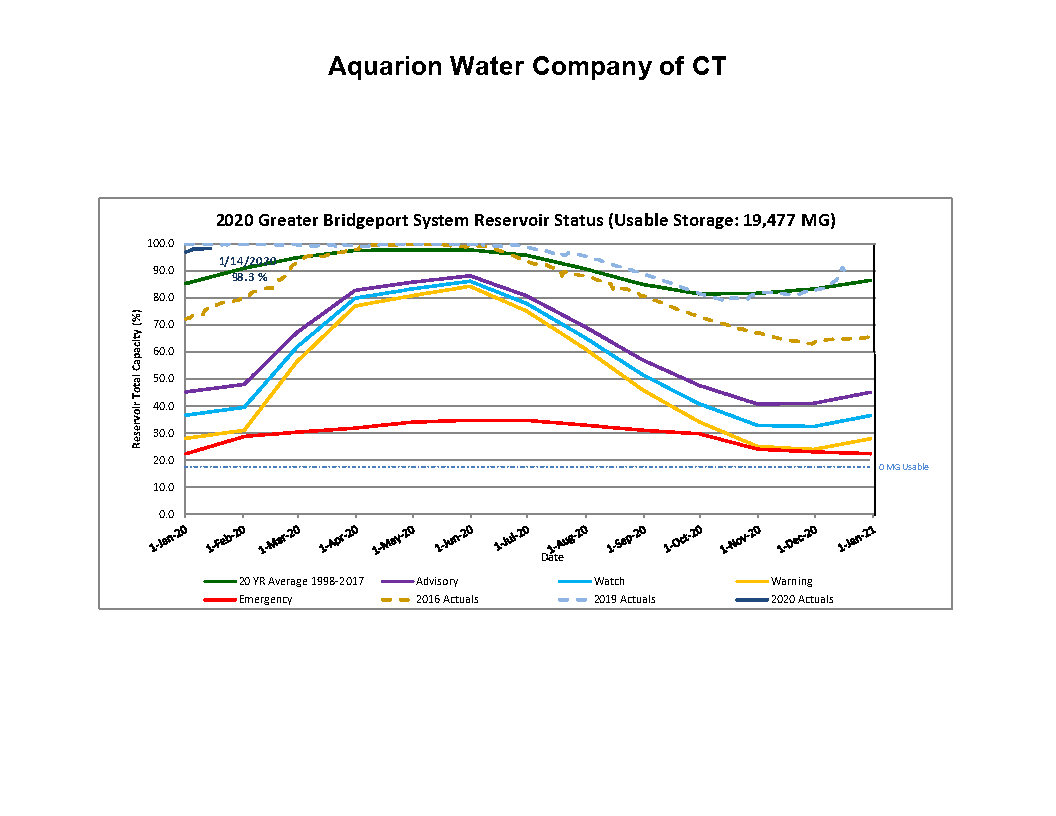
Figure 6a. Greenwich Rainfall Deficit | Download Chart PDF
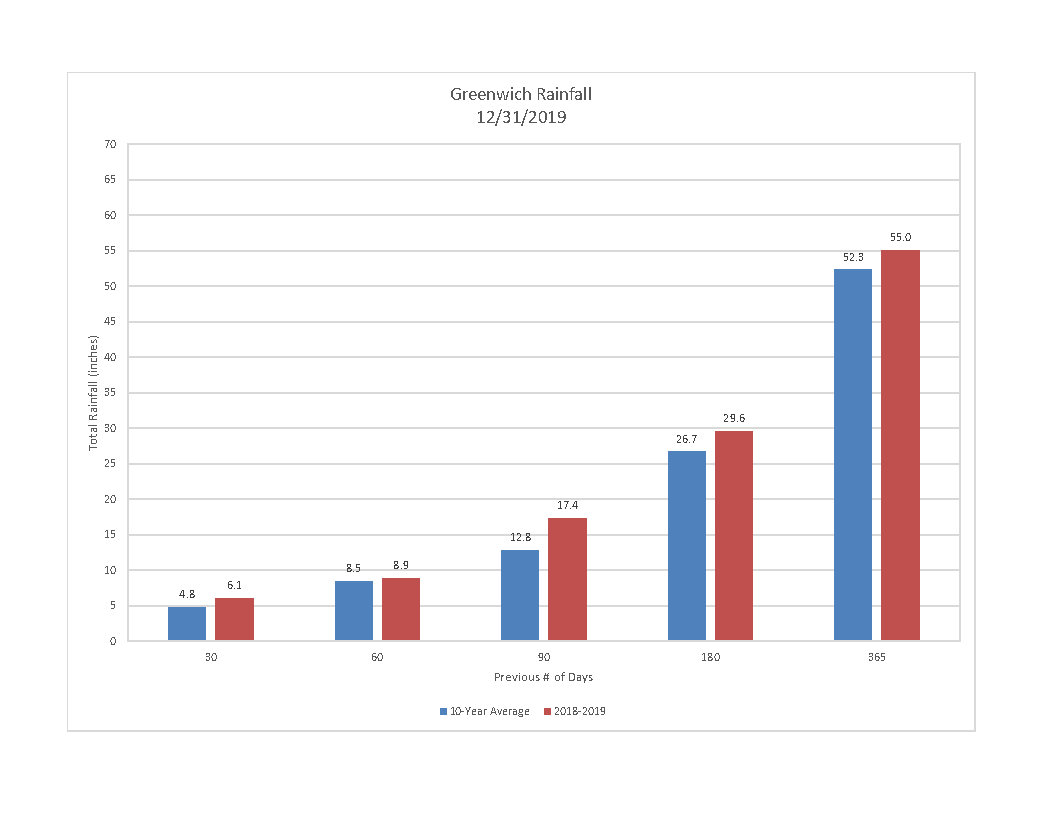
Figure 6b. Stamford Rainfall Deficit | Download Chart PDF
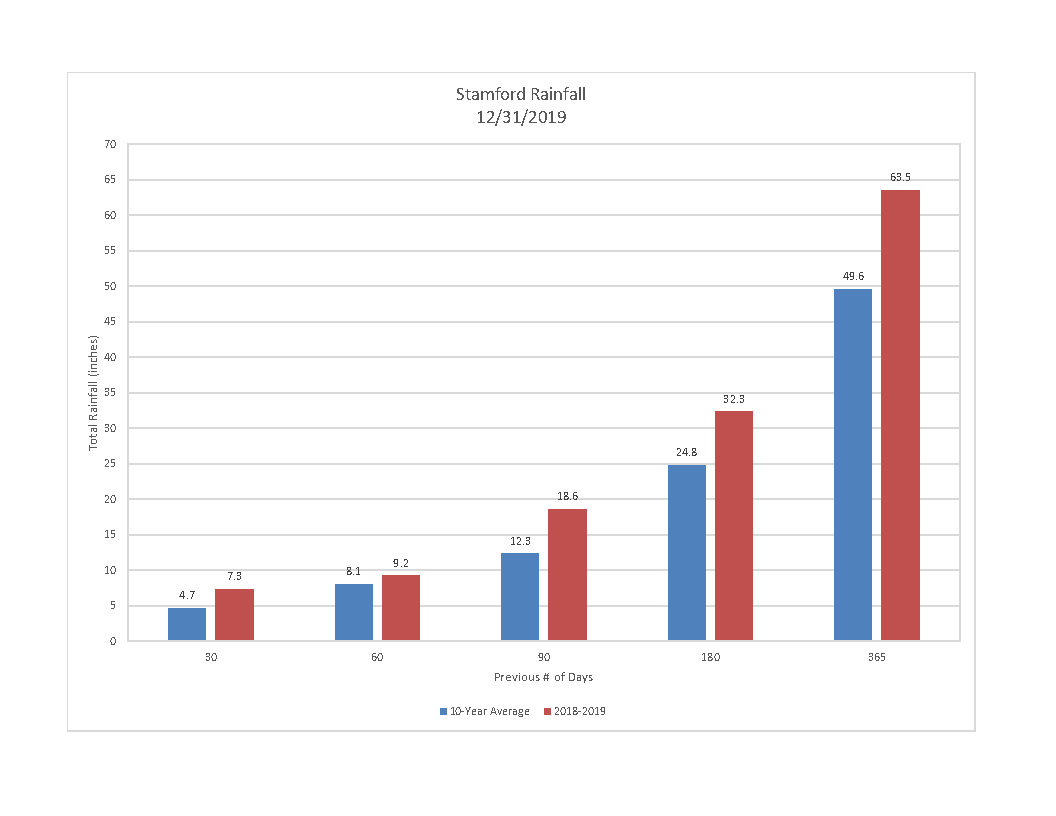
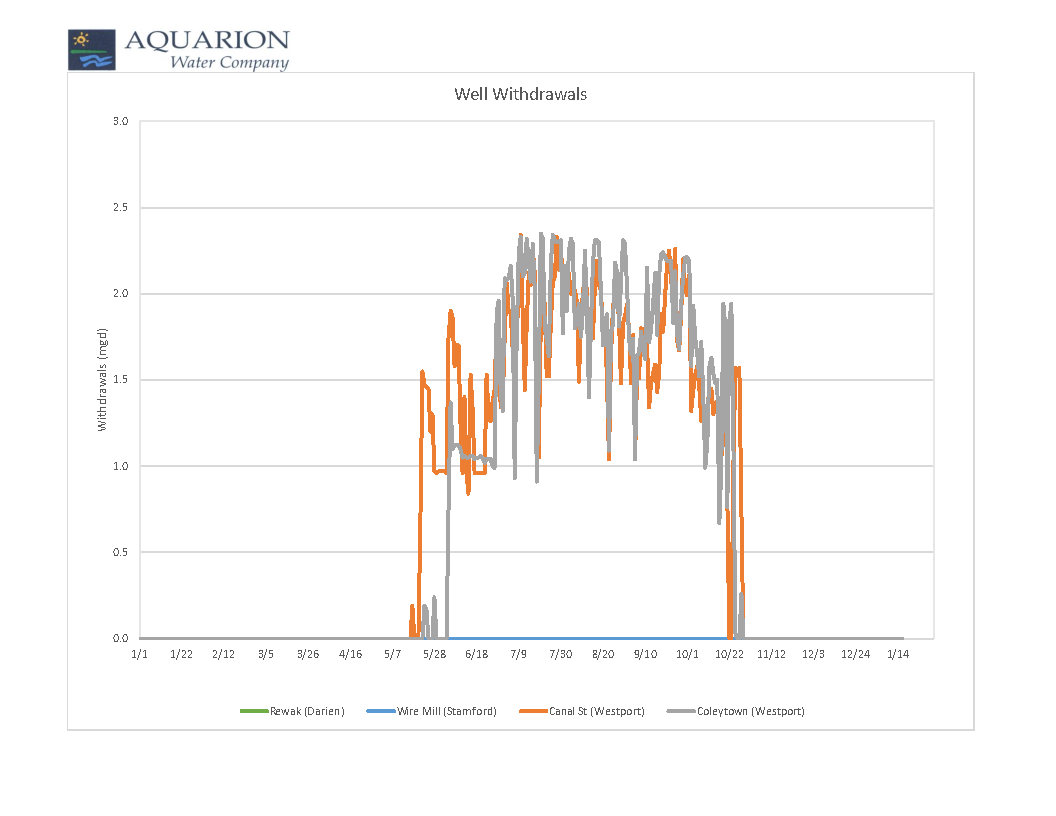
Figure 7. Daily Well Production (Rewak, Wire Mill, Canal Street and Coleytown Wells) | Download Chart PDF
© 2025 Aquarion Water Company Privacy Policy | Data Privacy Notice | Terms & Conditions | CIGNA Transparency in Coverage